Case Study
Minitab ConnectTM enables 360° data integration, saving Fortune 50 Telecom Giant $2.3 million in call center interactions ›
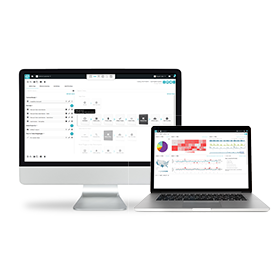
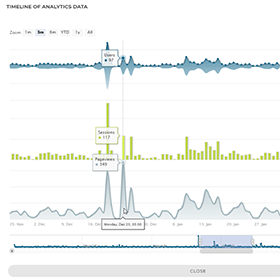
Monitor. Automate reports to share and track information for meaningful business intelligence. Instant alerts communicate changes requiring action or a deeper dive into your data.
Automate and Monitor Key Processes and Performance Indicators
Why continue building the same report and analysis every day, week or month? Use Minitab dashboards to set-up your report to run regularly and be shared easily with those that need to see it.
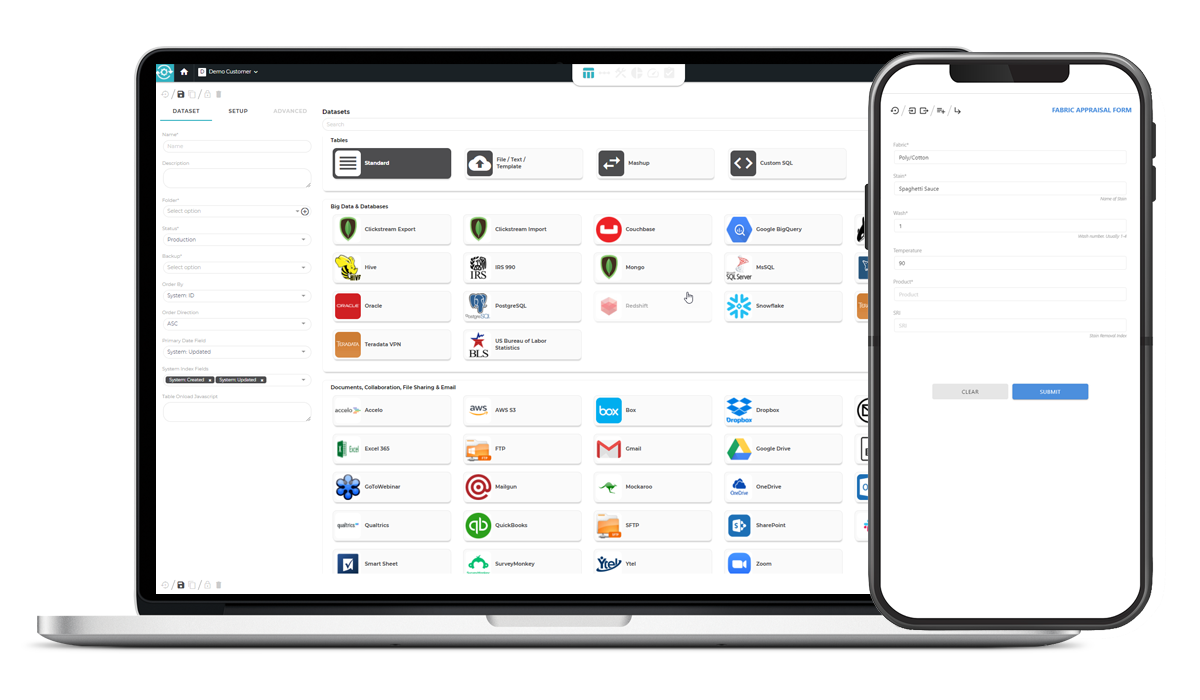
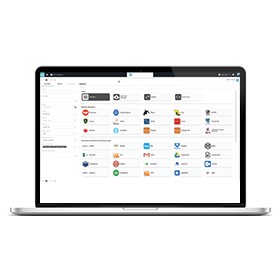
Access
Access and integrate your data from a variety of sources. Stop wasting precious time formatting and blending CSVs and spreadsheets. Minitab Connect allows you to set-up your analytics dashboard once and automatically updates as your data changes.
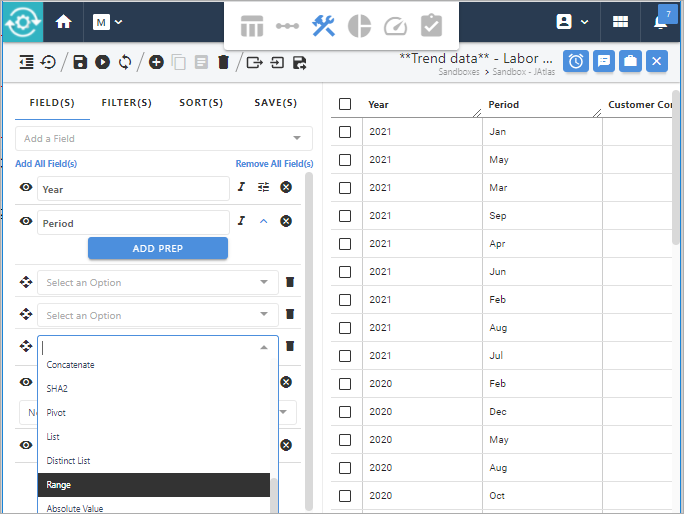
Self-service data preparation tools empower users – from data scientists to business analysts – to quickly and interactively, profile, curate, enrich, and shape diverse datasets using a spreadsheet-like interface.
Because the platform stores data resources in a centralized database, users can easily access and explore their data without risking data quality or security.
Data preparation steps can be shared with other users as repeatable workflows, eliminating repetitive data setup processes and maximizing productivity.
Seamless, direct access to Minitab® Statistical Software enables one-click delivery of prepped data for in-depth analysis.
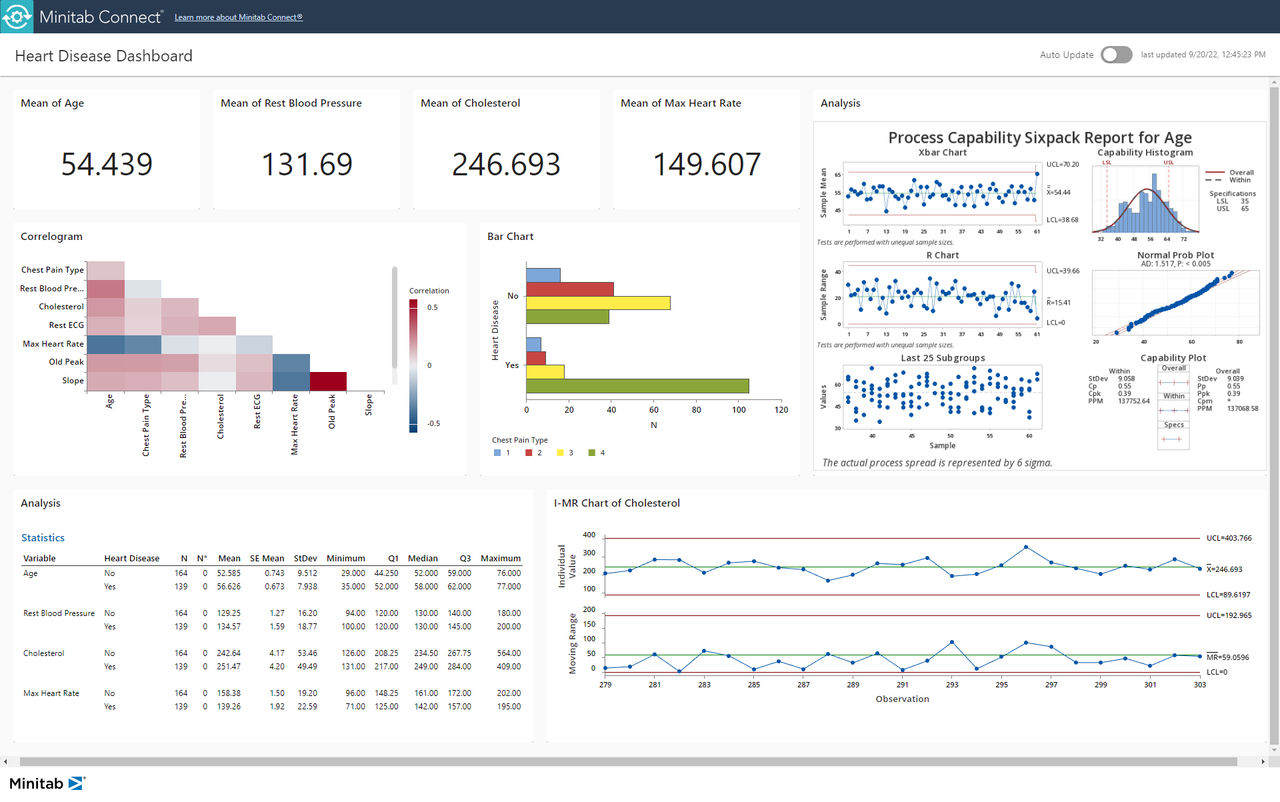
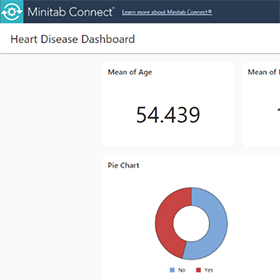
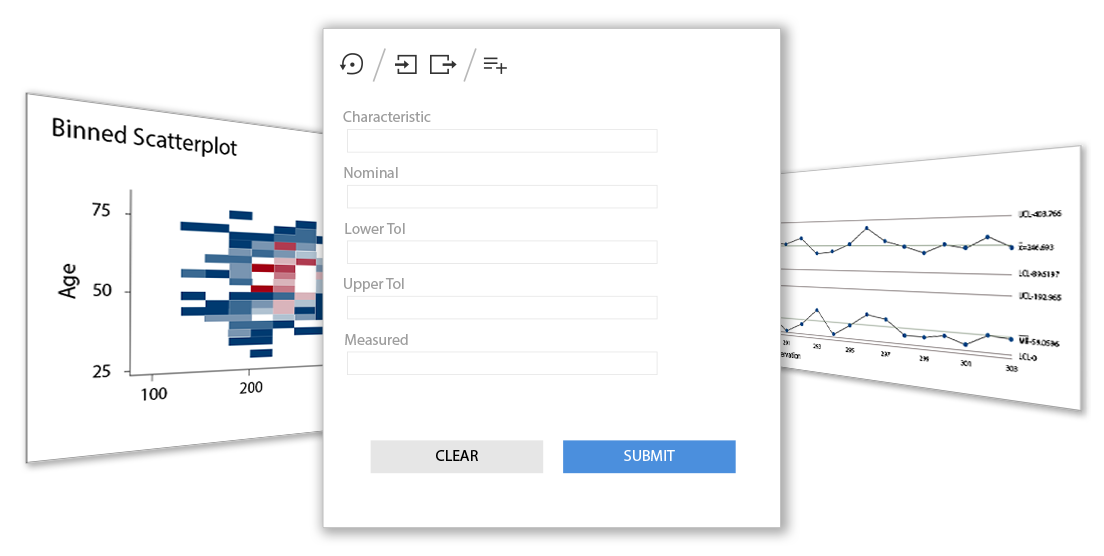
Dynamic, real-time visualizations with interactive elements allow users to explore data and develop deeper insights.
Dashboarding tools include highly flexible, configurable design and formatting options to facilitate meaningful reporting.
Data visualizations and dashboards can be shared - securely - with relevant stakeholders across the enterprise and beyond.
See How Our Clients Use Minitab Connect
Get the most out of Minitab Connect with these resources.
Grow Your Skills
Access analytical training and education from an easy-to-use web-based platform.
Gain insight into your data and improve your abilities with courses guided by expert statisticians.
Let our statistical consultants help you solve your quality improvement problems.
Ready to discover Minitab Connect?
Start your Solutions Analytics™ journey today with a free trial of select Minitab products! Access all the powerful capabilities, latest enhancements, and new features that Minitab has to offer with each trial.
Access the help you need to use our software from representatives who are knowledgeable in statistics, quality improvement, and computer systems.
You are now leaving minitab.com.
Click Continue to proceed to: